
Like several analytics tools, Matomo is a challenge for non analysts. Our client’s teams, who are not data analysts, need insights to make decisions. We aim to create simple dashboard for them to monitor their activity without having to deepdive in an analytics tool.
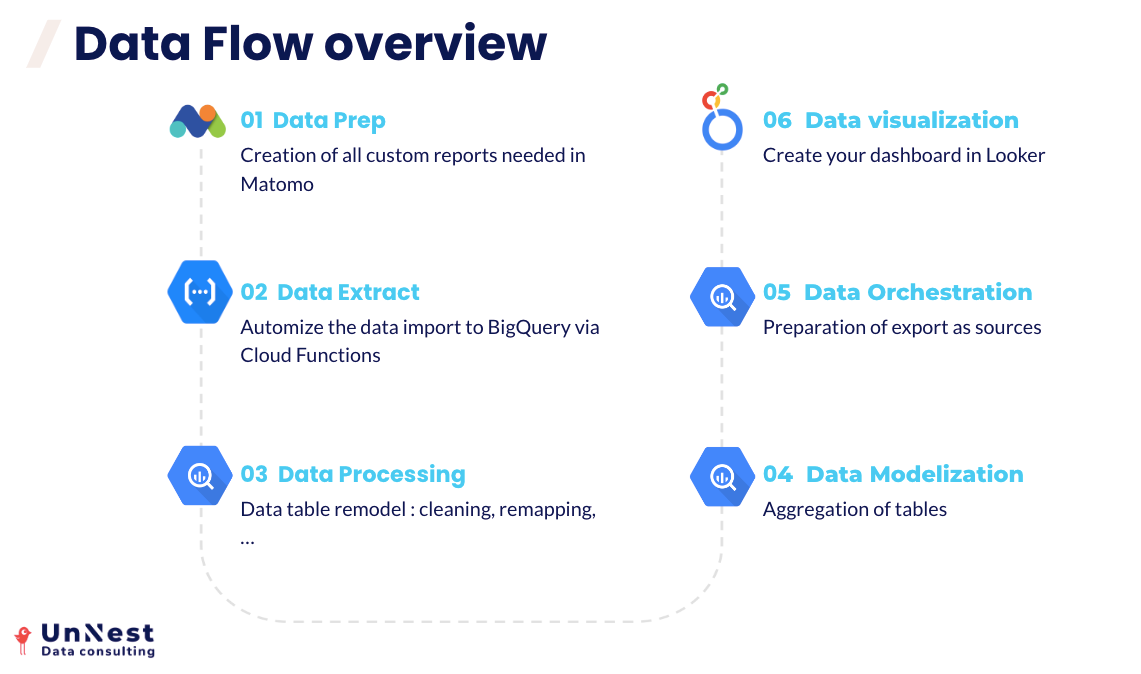
In this article, we will demonstrate and share with you the code to easily export data from Matomo Cloud or Matomo On Premise to build a dashboard in Looker Studio.
There are a few requirements :
- think upfront of the data you need in your dashboard and the custom reports you need to create to get them
- create a GCP environment. It is not free but almost. The cost of implementation and running for our clients are about a baguette and a croissant per month (9.09€ over the past 90 days for the use case we took here)
Data prep in matomo
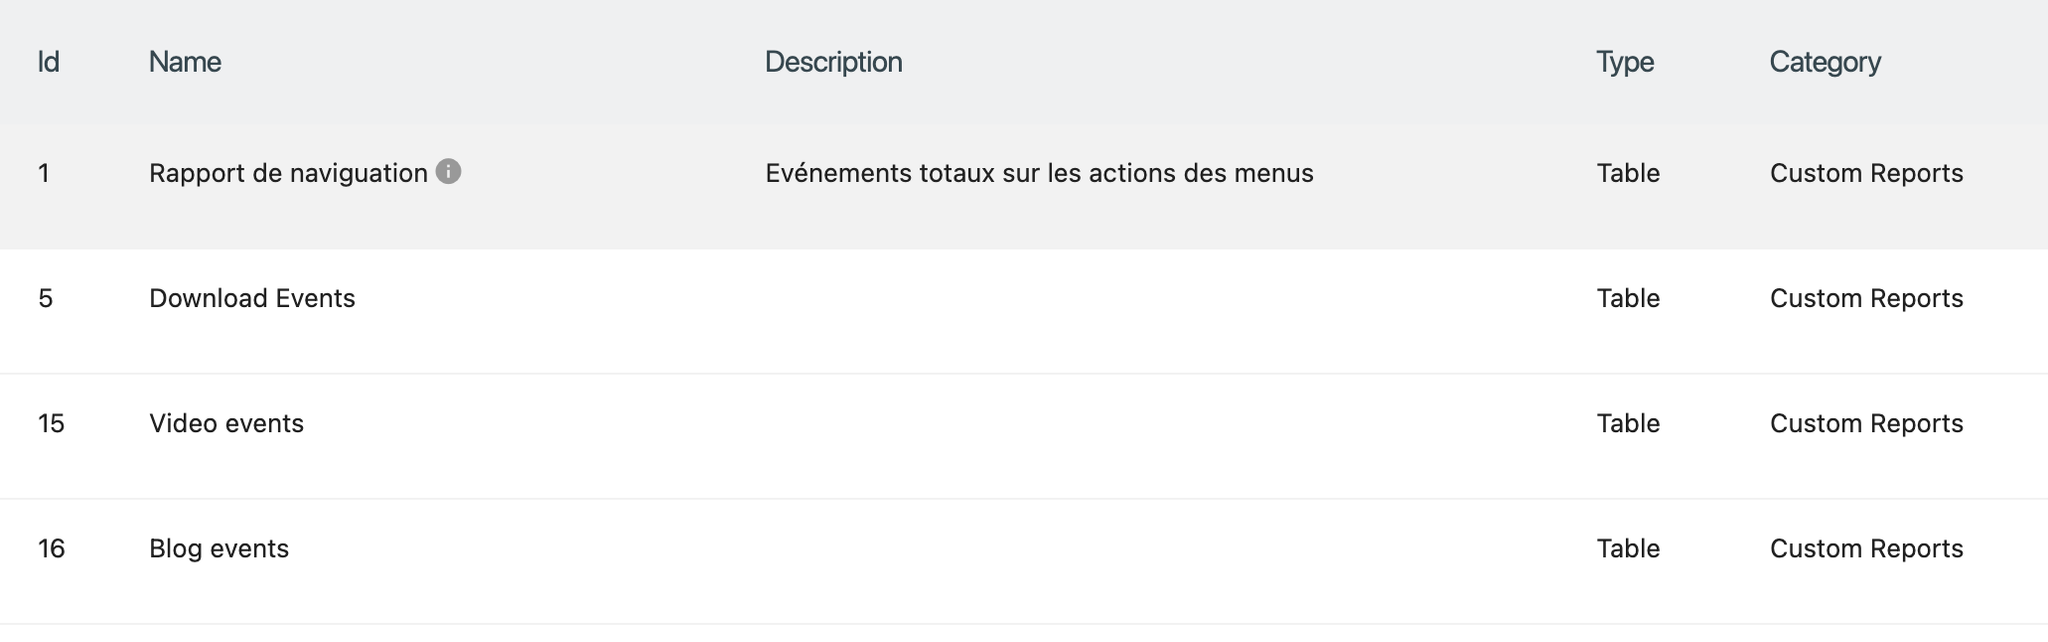
Create the custom reports you need and note the IDs
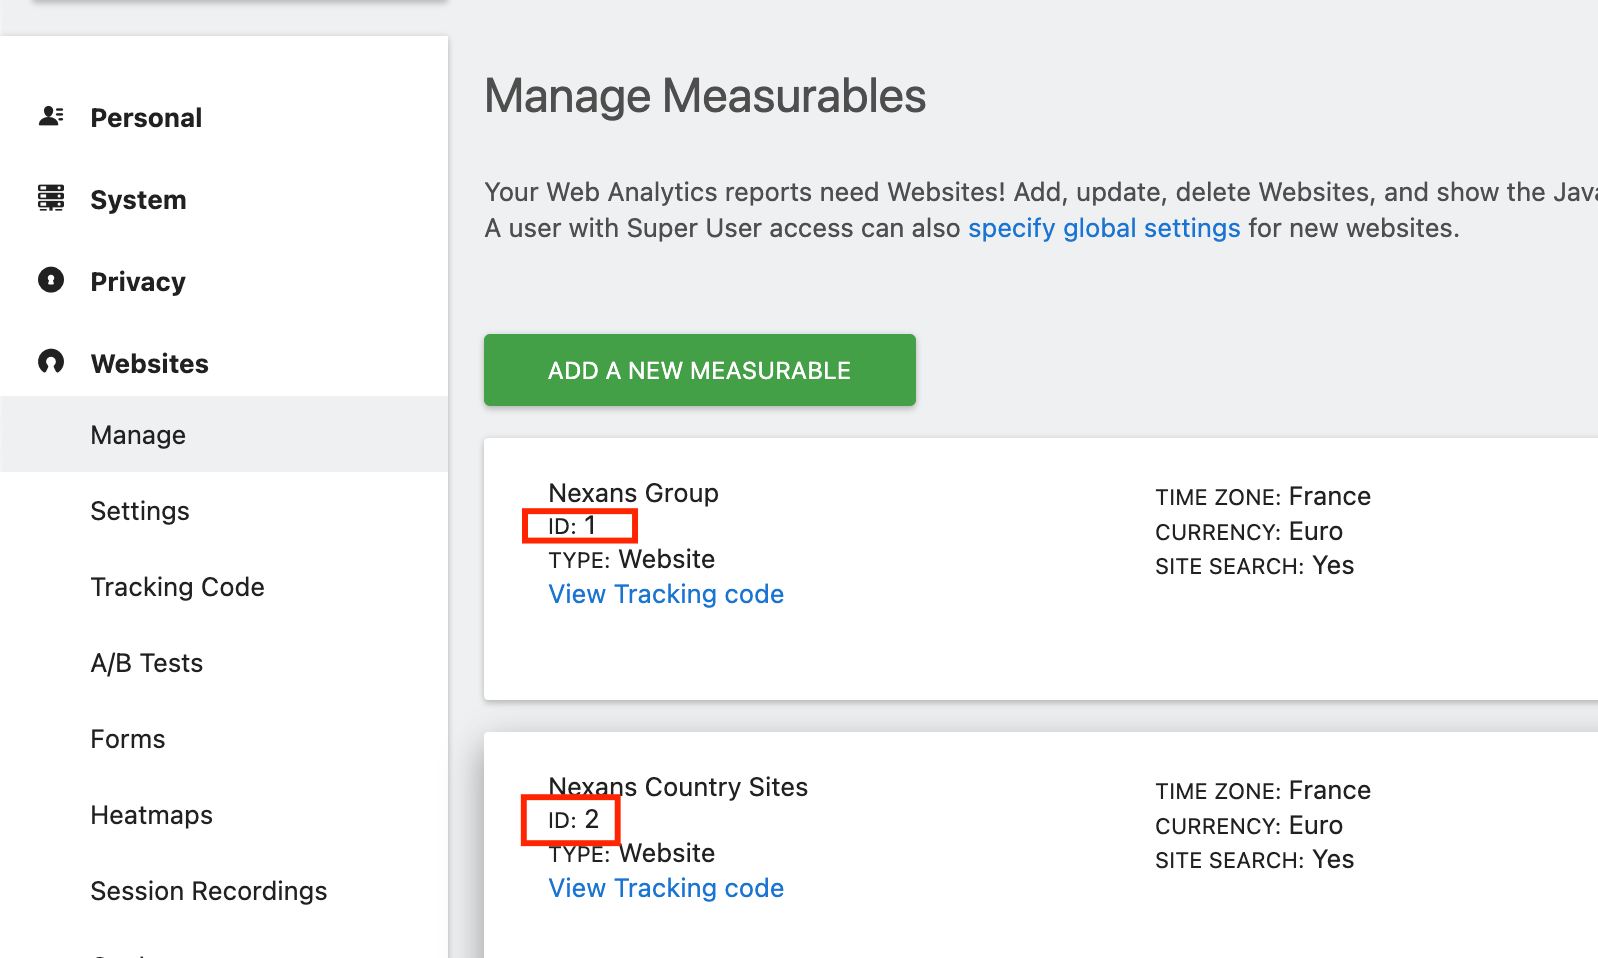
Get the Site IDs
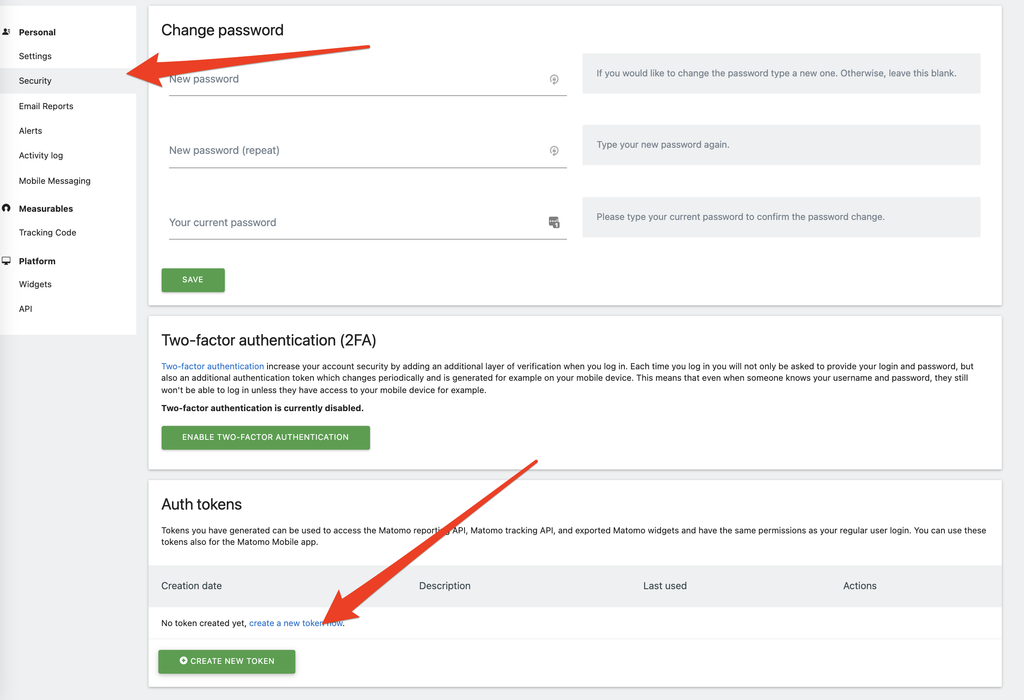
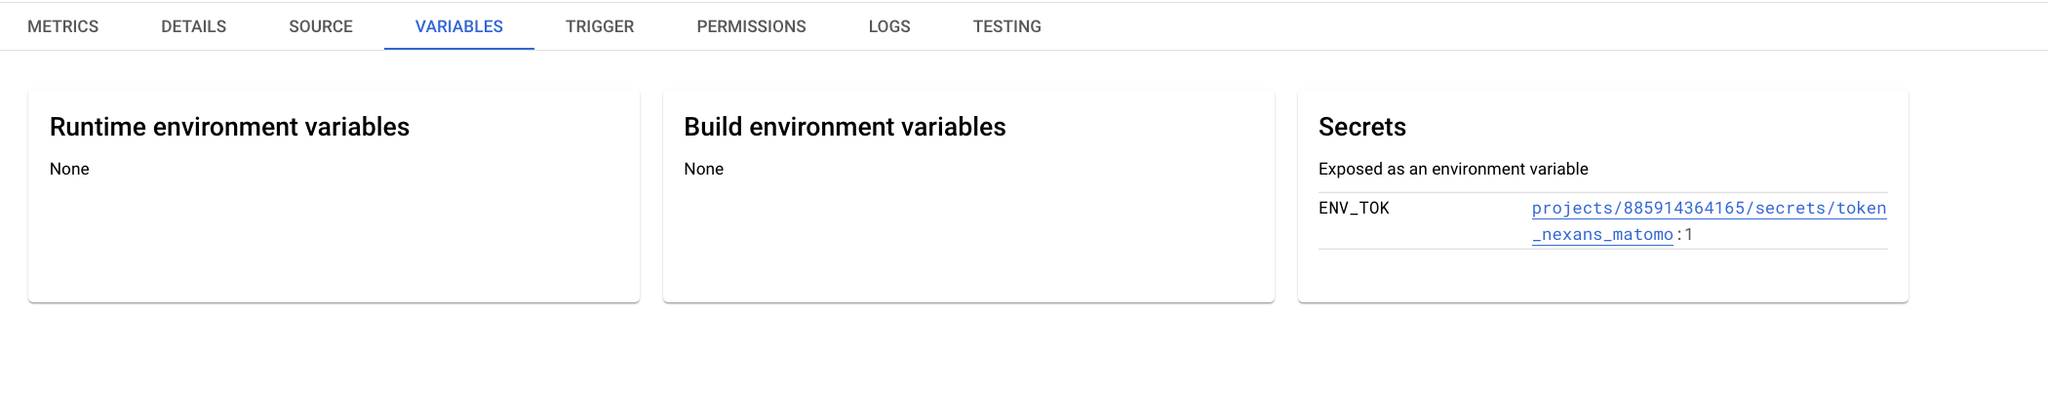
Get your authentification Token :
Data Extract
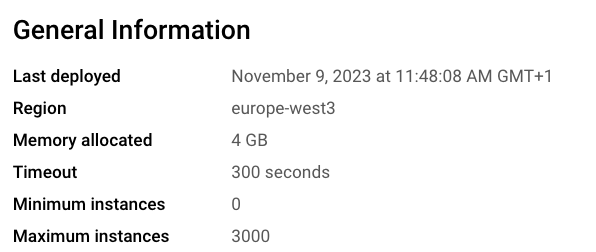
In GCP, create a new Cloud Function.
Relevant configuration details
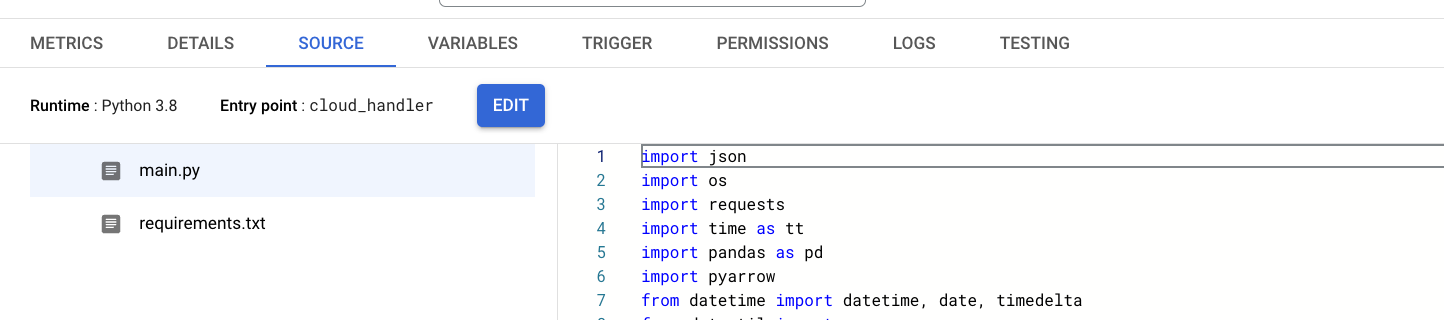
main.py
pythonimport json
import os
import requests
import time as tt
import pandas as pd
import pyarrow
from datetime import datetime, date, timedelta
from dateutil import parser
from google.cloud import bigquery
from google.cloud import secretmanager

# ADJUST NAMES HERE
project_id = "PROJECT_ID"

headers = {'Content-Type': 'application/json'}
TOK = os.environ.get("ENV_TOK", "Specified environment variable is not set.")

def extract(input_date):
    params = (('token_auth', TOK), \\
              ('apiAction', 'getCustomDimension'),\\
              ('language', 'en'),\\
              ('apiModule', 'CustomDimensions'),\\
              ('date', input_date),\\
              ('idDimension', '1'),\\
              ('filter_limit', -1),\\
              ('format', 'JSON'))
    r = requests.get('<https://MYSITE.matomo.cloud/?module=API&method=API.getProcessedReport&idSite=1&period=day&flat=1>', params=params,headers=headers,verify = False)
    print(params)
    print(r)
    # Replace MYSITE by the one in your URL
    j = json.loads(r.text)
    return j

def execute_bq_job(df):
    print("start_bq")
    cl = bigquery.Client()

    # ADJUST NAMES HERE
    PROJECT_ID = "PROJECT_NAME"
    DATASET_ID = "DATASET_ID"
    table_name = "TABLE_NAME"

    try:
        dataset = bigquery.Dataset(f"{PROJECT_ID}.{DATASET_ID}")
        dataset.location = "EU"
        dataset = cl.create_dataset(dataset)  # API request
    except:
        print('dataset not created')
    dataset = cl.dataset(DATASET_ID)
    job_config = bigquery.LoadJobConfig()
    job_config.autodetect = True
    job_config.write_disposition = "WRITE_APPEND"
    job_config.create_disposition = "CREATE_IF_NEEDED"

    load_job = cl.load_table_from_dataframe(
        df, dataset.table(table_name), job_config=job_config
    )  # API request
    print("Starting job {}".format(load_job.job_id))

    load_job.result()  # Waits for table load to complete.
    print("Job finished.")

def clean_columns(df):
    print("clean_start")
    df.columns = df.columns.str.replace(r'(', '')
    df.columns = df.columns.str.replace(r')', '')
    df.columns = df.columns.str.replace(r'[', '')
    df.columns = df.columns.str.replace(r']', '')
    print("end clean")
    return df.columns.str.replace(' ', '_')

def cloud_handler(request):
    # Par défaut si aucun paramètre de date n'est renseigné la fonction tournera sur la donnée de la veille
    """
        :param request:
        :return: success/error message
    """
    request_json = request.get_json(silent=True)
    request_args = request.args
    default_date = datetime.now() - timedelta(days=1)

    if request_json and 'start_date' in request_json:
        start_date = request_json['start_date']
    elif request_args and 'start_date' in request_args:
        start_date = request_args['start_date']
    else:
        start_date = default_date.strftime("%Y-%m-%d")

    if request_json and 'end_date' in request_json:
        end_date = request_json['end_date']
    elif request_args and 'end_date' in request_args:
        end_date = request_args['end_date']
    else:
        end_date = default_date.strftime("%Y-%m-%d")

# command: zip -r cloud_function.zip applibs/bigquery_util.py applibs/google_cred.json main.py requirements.txt
    try:
        print(f"Start processing at: {datetime.now().isoformat()}")

        input_date = datetime.strptime(start_date,"%Y-%m-%d")
        end_date = datetime.strptime(end_date,"%Y-%m-%d")
        delta = timedelta(days=1)
        print("end_date : ", end_date)
        while input_date <= end_date:
            print("input_date : ", input_date)
            # Extract data
            request_data = extract(input_date)
            data = request_data['reportData']
            df = pd.DataFrame(data = data)
            print(data)
            date = parser.parse(request_data['prettyDate']).strftime("%Y-%m-%d")
            json_data = []
            processed_datetime = str(datetime.now())
            print(processed_datetime)
            print(input_date)
            print(date)
            # store data

            if data:
                df.columns = clean_columns(df)
                df["date"] = datetime.strptime(date,"%Y-%m-%d")
                df["_processed_datetime"] = processed_datetime
                execute_bq_job(df)
            print(f"End processing at: {datetime.now().isoformat()}")
            input_date += delta

            #if res != "success":
            #    print("error: " + res)
            #    return {"message": res}, 400

        return {"message": "Data saved successfully."}, 200

    except Exception as error_info:
        print(error_info)
        return {"message": error_info}, 400
requirements.txt
pythongoogle-api-core==2.4.0
google-api-python-client==2.36.0
google-auth==2.3.3
google-auth-httplib2==0.1.0
google-cloud-bigquery==2.32.0
google-cloud-core==2.2.2
google-cloud-firestore==2.3.4
google-cloud-storage==2.1.0
google-resumable-media==2.1.0
googleapis-common-protos==1.56.4
google-cloud-secret-manager
python-dateutil==2.8.2
pandas
pyarrow
Data Processing
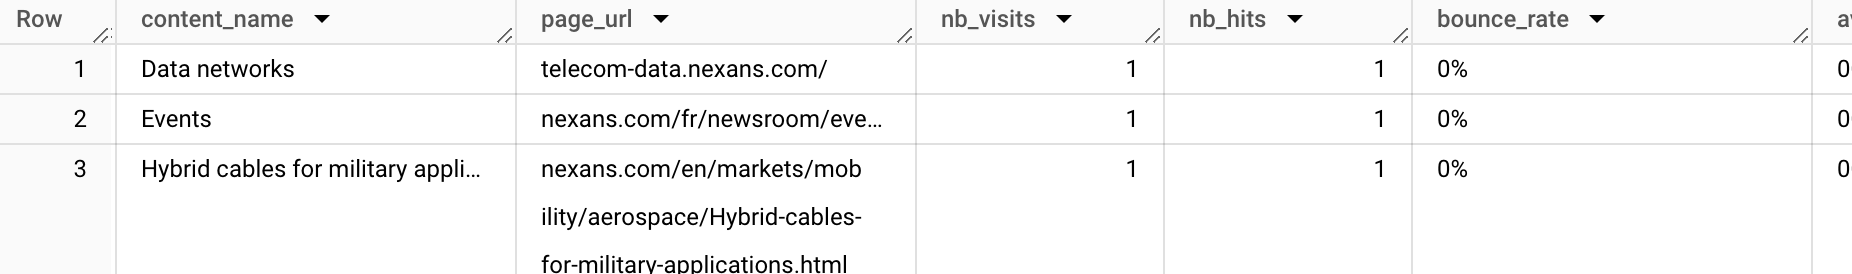
Raw data

sqlselect
  _processed_datetime,
  date(date) as date,
  split(label,' - ')[safe_offset(0)] as content_name,
  split(label,' - ')[safe_offset(1)] as page_url,
  nb_visits,
  nb_hits,
  bounce_rate,
  avg_time_on_dimension,
  exit_rate,
  avg_time_generation
from  `un-nexans.src_matomo.matomo_contentName_group`
qualify   row_number() over(partition by date,	label order by _processed_datetime desc) = 1
It splits the label and avoids duplicated rows when the data is imported several times.
Output
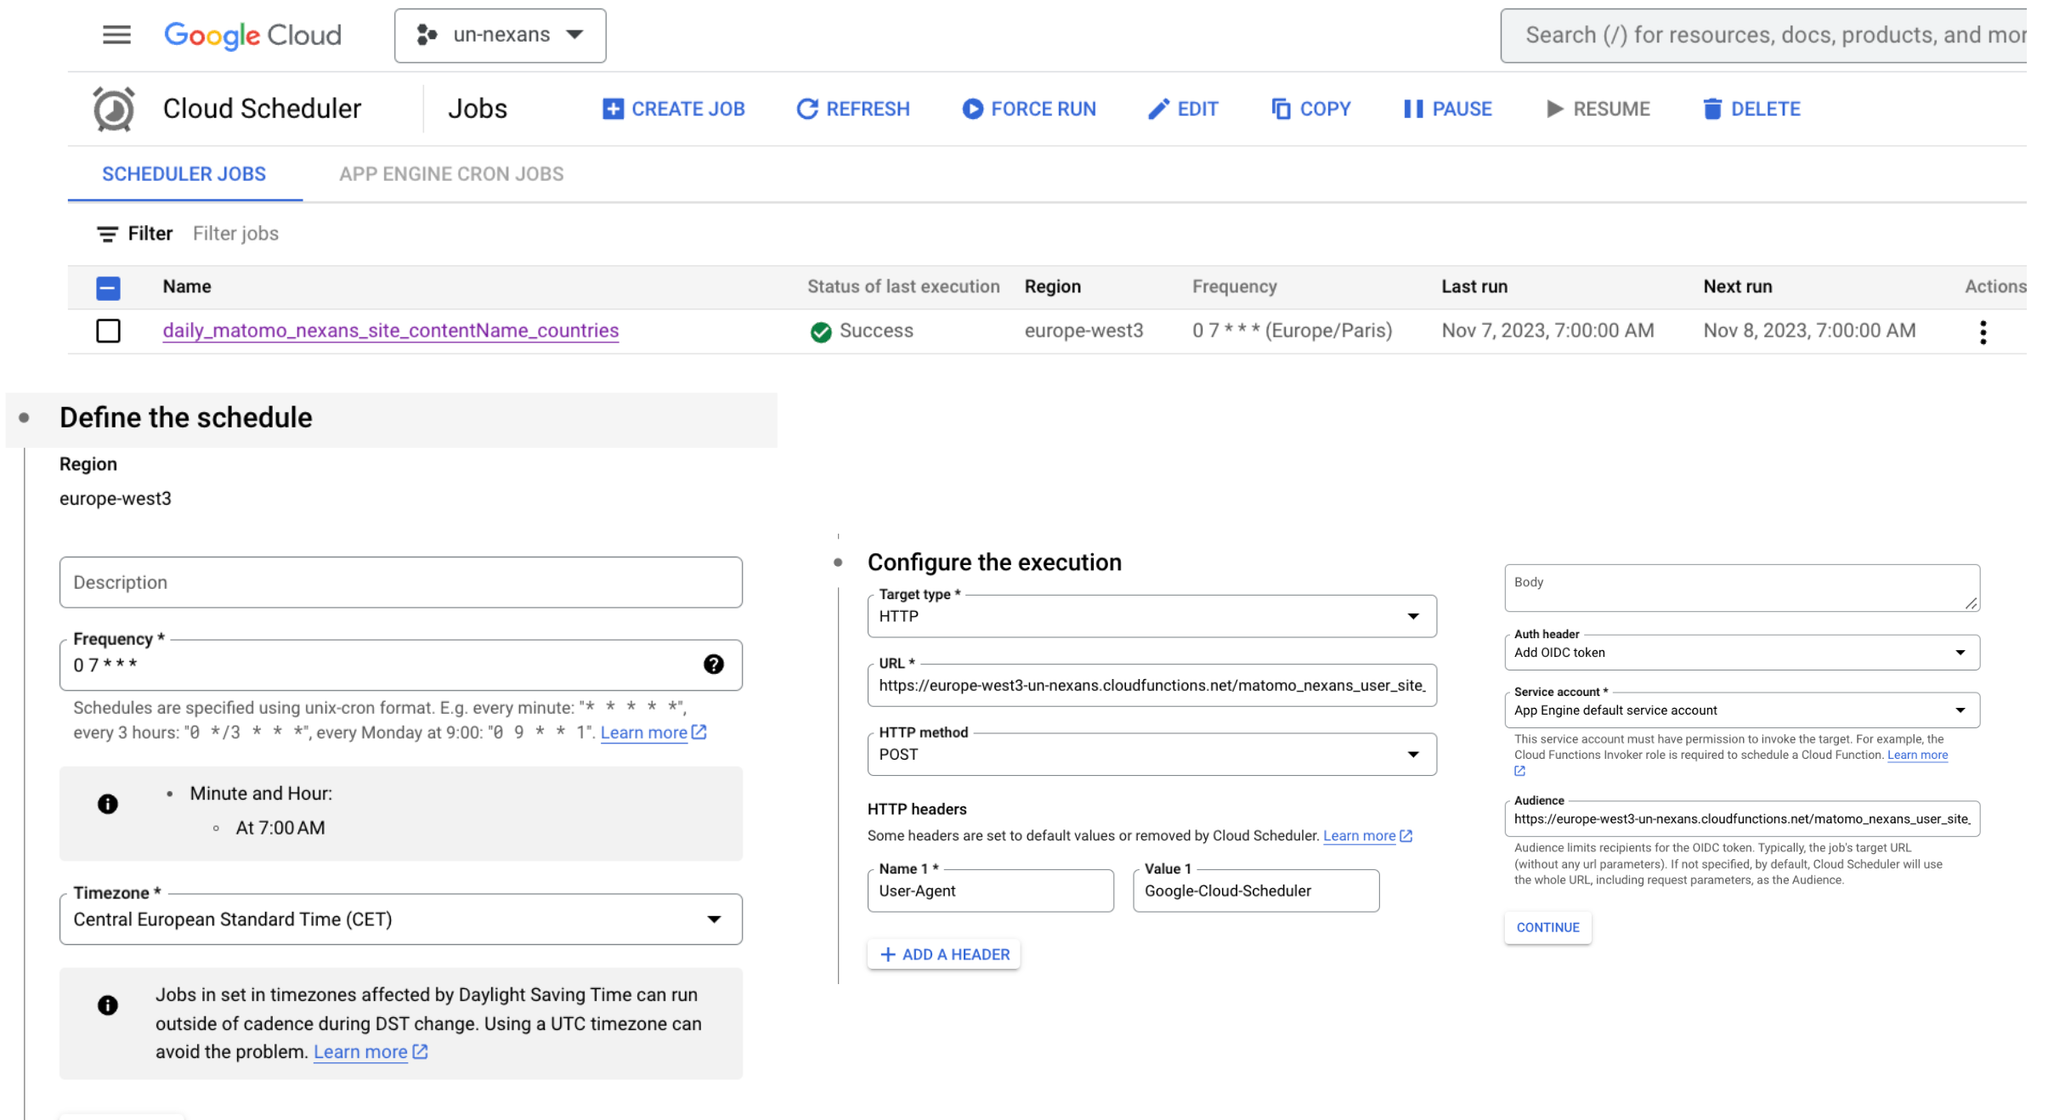
Schedule your import
Use the Cloud Scheduler to schedule daily imports
Data Modelization
To aggregate data, use the join function. The metrics should be consistent accross tables so you can use one source only. In the following exemple, we use the page URL and date as keys to join the data.
sqlwith
  prep as (select * from  `un-nexans.stg_matomo.v_deduped_matomo_content1_group` qualify row_number() over(partition by date, page_url order by nb_hits) = 1),
  prep2 as (select * from  `un-nexans.stg_matomo.v_deduped_matomo_content2_group`qualify row_number() over(partition by date, page_url order by nb_hits) = 1),
  prep3 as (select * from  `un-nexans.stg_matomo.v_deduped_matomo_content3_group`qualify row_number() over(partition by date, page_url order by nb_hits) = 1),
  prep4 as (select * from  `un-nexans.stg_matomo.v_deduped_matomo_contentName_group`qualify row_number() over(partition by date, page_url order by nb_hits) = 1)

SELECT DISTINCT
  prep.date,
  prep.page_url,
  prep.content_path_1,
  prep2.content_path_2,
  prep3.content_path_3,
  prep4.content_name,
  prep.nb_visits,
  prep.nb_hits,
  prep.bounce_rate,
  prep.avg_time_on_dimension,
  prep.exit_rate,
  prep.avg_time_generation
FROM prep
full JOIN prep2 using(date, page_url)
full JOIN prep3 using(date, page_url)
full JOIN prep4 using(date, page_url)
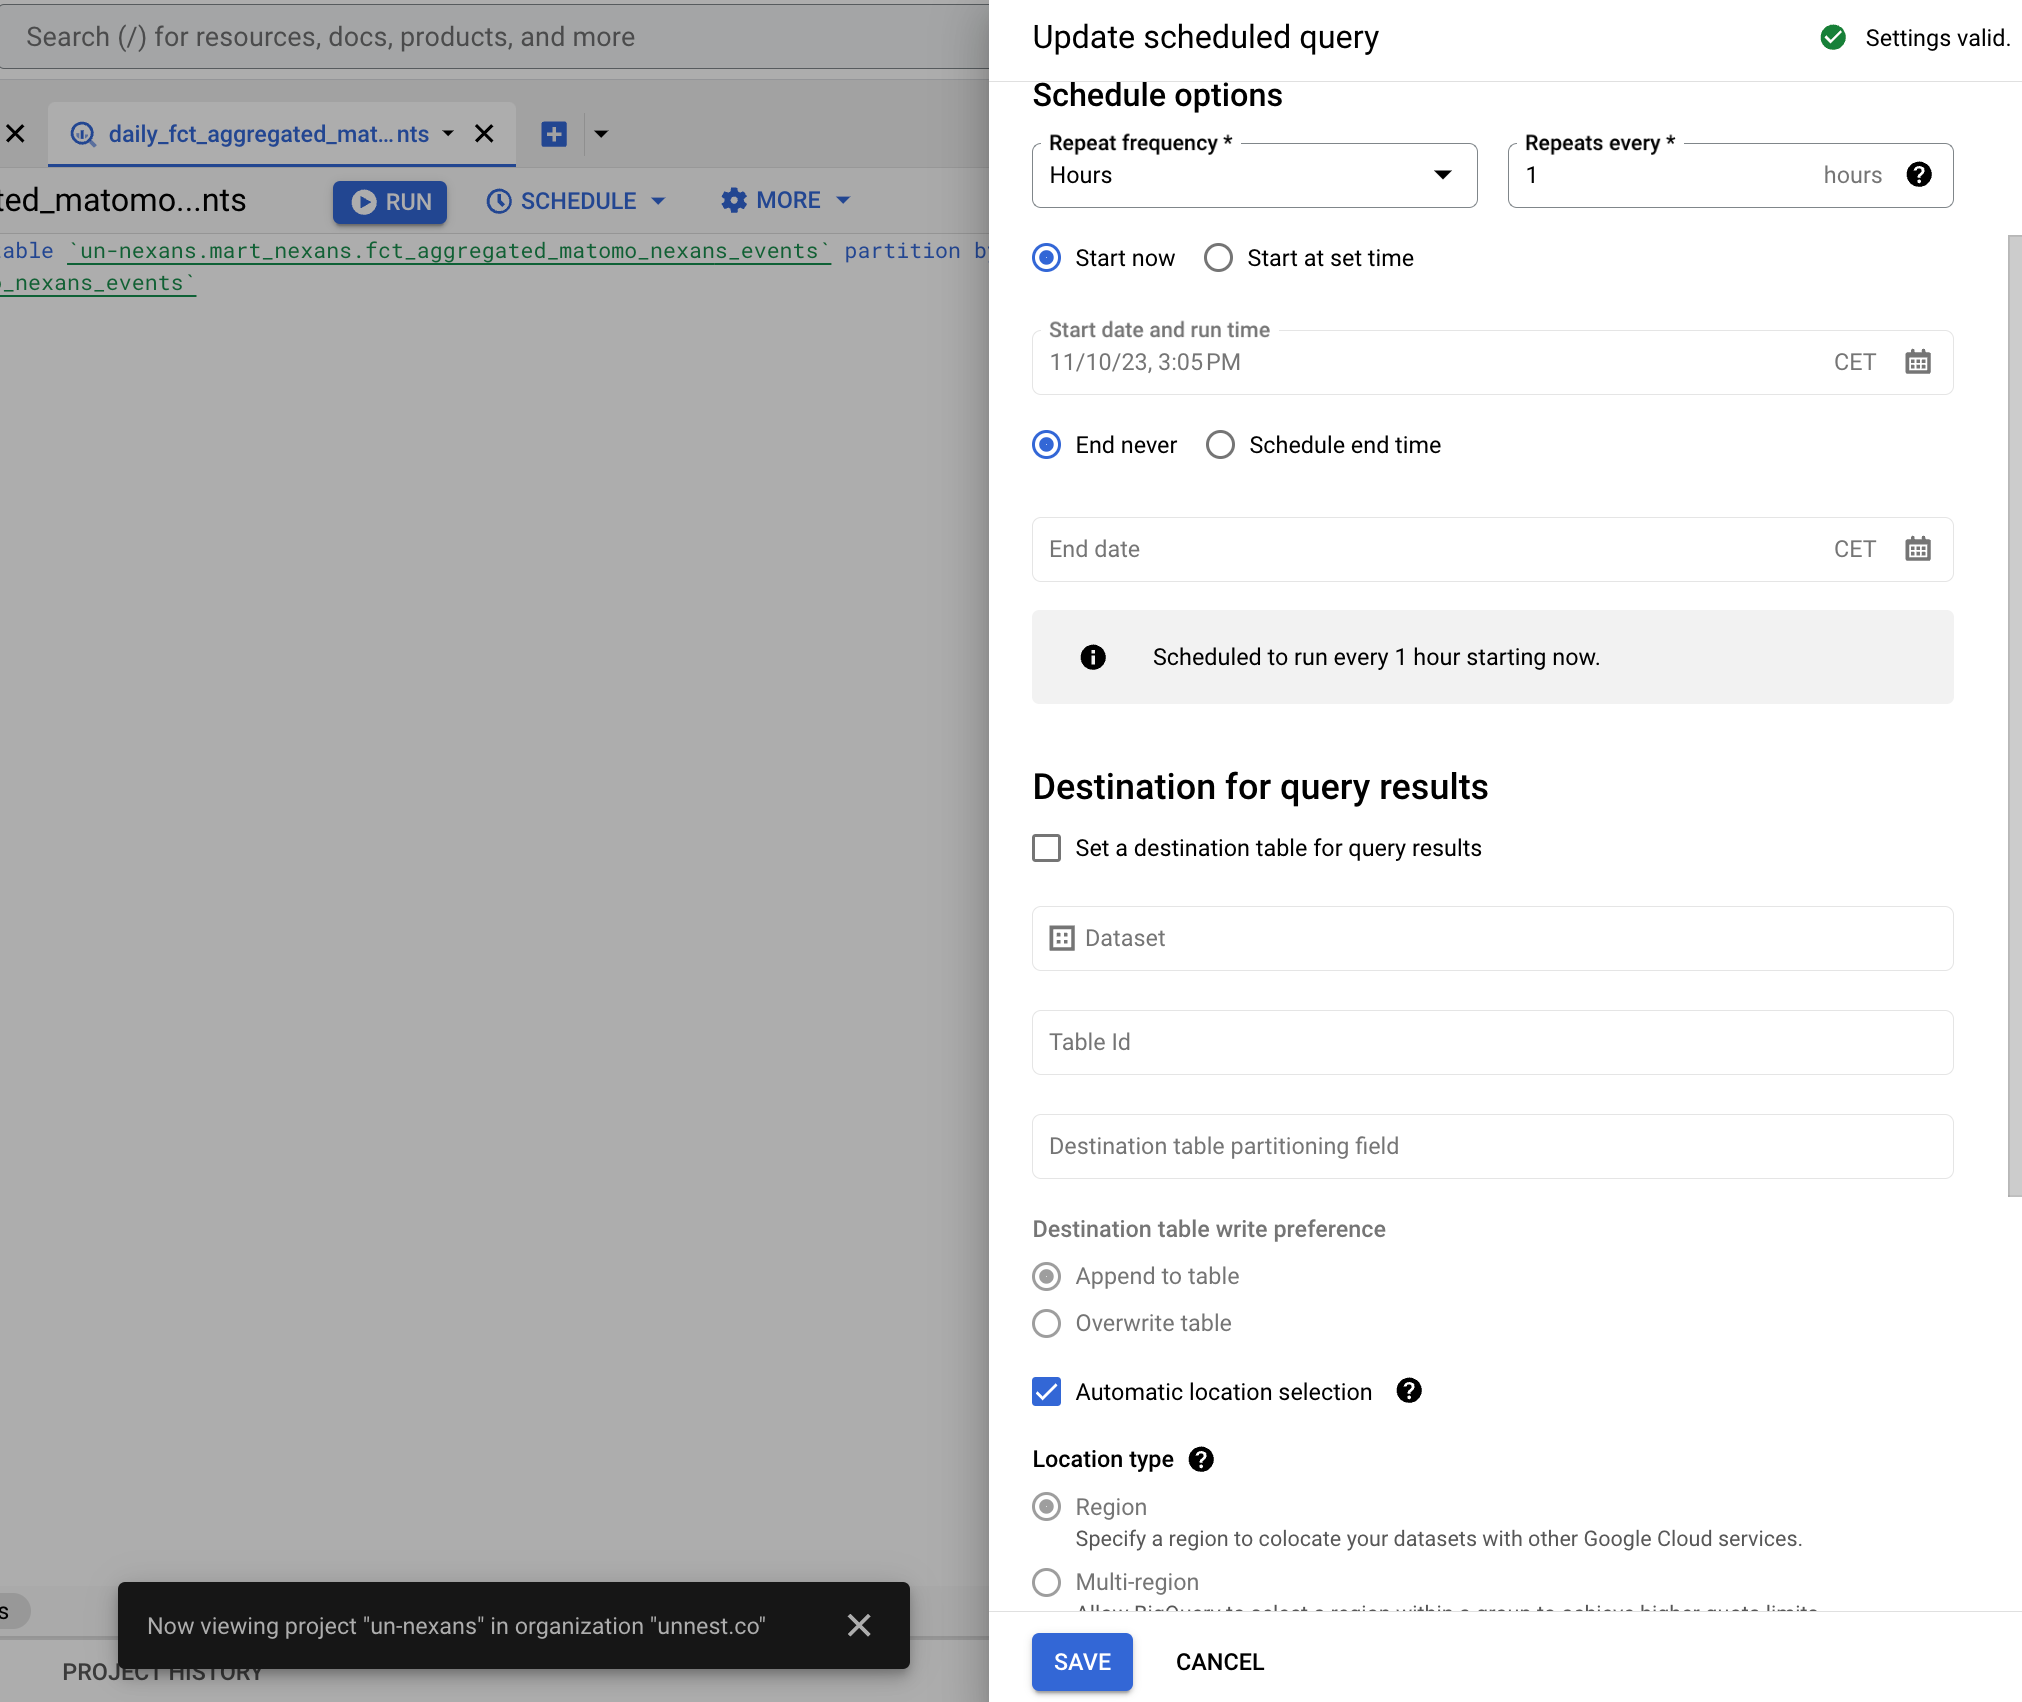
Data orchestration
Create a new query to create a partionned table that you will refresh every day or every hour to get the most recent data in Looker.
sqlcreate or replace table `un-nexans.mart_nexans.fct_aggregated_matomo_nexans_events` partition by date_trunc(date, month) as
select * from `un-nexans.mart_nexans.v_aggregated_matomo_nexans_events`
Data Visualization in Looker
With the same credentials go to looker studio and in your dashboard, add a new data set.
With the Big Query connector, you can access all your tables. Just add the partioned table and create your dashboard !